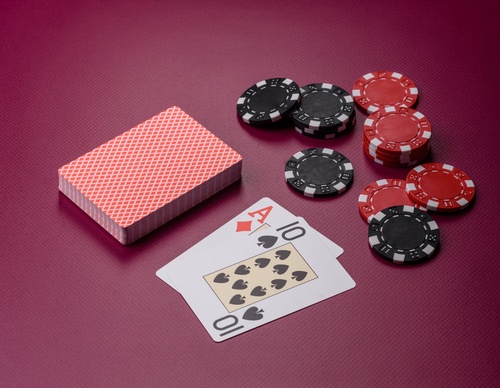
All of these traits find their counterparts in trading: understanding the market macros, analysing company fundamentals, calculating the win rate of a trade, profit and loss ratios, risk factors, and a fairly good memory of historical and recent market events and price action. And it goes without saying that discipline is paramount in trading. A comparison drawn this way is on the technical aspect. However, playing good poker is a multifaceted mastery, and usually it is the skill beyond the technical that saves the day. Enter playing fear.
Playing fear
A serious player earns most of their profit from hands that never reach a showdown. They bet, everybody folds, and they take the pot without showing anyone what they were holding. Frequently they are holding nothing.
The term for this is fold equity. It is the value of a bet that comes purely from the chance that other players give up, and it is entirely separate from the value of the hand you are holding. A hopeless hand can be a profitable bet if the story is frightening enough and the other players have enough to lose.
The refined version is the semi-bluff. You bet with a hand that is behind right now but could improve later. Now there are two ways to win. The others fold and you take the pot immediately, or they call and you make your hand on a later card. Neither route requires you to be ahead at the moment you put the money in. That is why it is the most dependable aggressive play in the game.
There is an arithmetic constraint on all of this. Say the pot holds 100 and I bet 100 into it. You have to put in 100 to win 200, so calling pays if you are good more than a third of the time. A 34% win rate is enough. Turn it around and it binds me too: if you fold more than half the time, my bet with nothing pays for itself.
So the table settles into a pair of frequencies. I should be bluffing about a third of the times I bet that size, and you should be calling about half of them. Neither number depends on courage, on reading my face, or on whether my story sounds convincing. They fall out of the pot-to-bet ratio, and a player who drifts away from them in either direction is handing money to the other side.
That is playing fear, and the rest of this piece is about the same two frequencies operating in a market.
How a fold actually works
It is easiest to see how that plays out in a single stock.
Take a mid-cap that does not exist. It trades at $40, with 50m shares in the float and 1m traded on a normal day. Three long funds hold 3m shares between them. The retail tail keeps its stops at the obvious levels, under $36 at the prior low and again at $34 where the 200-day runs.
A hedge fund shorts 3m shares, 6% of the float, and makes the bet visible. Visibility comes either from a published thesis or from a persistent offer sitting in a thin book. In poker terms, the falling price is the bet and the size is the message.
At $36 the stops trigger. 1.5m shares of forced selling hit a book that clears 1m on a good day, and the price gaps through $34 to $33. That takes out the 200-day, and now the long funds have a different problem: a risk committee looking at a position down 15% in a name that just broke the level everyone watches. They sell their 3m. Meanwhile, nothing about the fundamentals of the company changes.
The fund has to buy its 3m back, and the people capitulating are the only ones offering size. The folds did not just move the price. They are also the way out of the trade. So the fund bids into the selling, which is the one thing that can slow it. Of the 4.5m shares coming out of frightened hands, 3m go straight back to the fund that frightened the holders out, and that bid is why the fall stops at $30 instead of running further.
What is left at $30 is a holder base nothing can frighten. The stops are cleared, the long funds are out, and the float sits with index money and whoever bought the capitulation. The pot has been collected.
This is when the short case looks strongest on the chart, and short interest rises as new funds put the trade on at $30 because it is working. Then earnings come in fine. There is nobody left who has to sell, so it takes very little buying to move the price, and it goes $30, $33, $37.
So a fold in a market is a trade at a price the folder would have refused earlier. A position cannot be surrendered. It can only be transferred, which means every fold needs a buyer on the other side of it. Each fold removes a future seller. Collect them all and the next player to bet has nothing left to win.
The climb is paid for by the folds
A whole market does the same thing on a longer clock. Nobody needs to be running a raid. A macro scare empties the book without help, and the folds are the same folds. What changes is that at index level there is a proxy for the fear, in the price of protection, and it has 36 years of history.
Take every trading day since 1990 and sort them by how frightened the market was at the previous close.
| VIX at the previous close | Share of all sessions | Annualised return | Share of total compound growth |
|---|---|---|---|
| below 15 | 32% | 7% | 27% |
| 15 to 20 | 31% | 5% | 20% |
| 20 to 30 | 29% | 6% | 20% |
| above 30 | 8% | 42% | 34% |
8% of the sessions carried a third of everything the S&P 500 has made in 36 years. The calm two-thirds of the record, where almost all of investing is experienced, compounded at 5% to 7%. That top row also carries four times the volatility of the bottom one, so it concentrates the risk as much as the return.
A bet doesn’t win the pot
“Markets rise on fear” treats all fear as one thing. Look only at markets already down more than 10%, so the bad news is real in every case, and split them by how violent the selling got.
| Market more than 10% below its high | Mean | Median |
|---|---|---|
| VIX in the twenties | +2.8% | +9.3% |
| VIX above 30 | +22.7% | +22.9% |
| A calm market near its high | +11.2% | +12.1% |
Only the top row is robust. Take out 2000–02 and 2007–09 and it barely moves, at +26.7%. The twenties do not survive the same test: without those two crises they return +16.9%, better than the calm baseline, and on medians they were never far from it anyway. So the claim has to be narrower than the table first suggests. Violent selling has been followed by strong returns in every era of the record. Moderate fear is just where the historical left tails happen to live.
A bet does not win a pot. A fold wins a pot. Until the capitulation the capital that would fund a recovery is still in the position, hoping, and the pot belongs to no one.
The same test kills a more comfortable idea. Depth of decline, on its own, tells you nothing about what comes next. A market down 20% has no better forward return than one at an all-time high. Cheapness is not fold equity. Only the violence of the selling tells you whether anyone has left.
Which is the inversion at the centre of this. The raider’s edge was fold equity he had not yet collected. The buyer’s edge at the bottom is fold equity that is gone. You are not betting that people will fold. You are betting that they already have.
The best bluff ever made
The purest demonstration of all this was not in equities at all.
In July 2012 the euro was being priced for breakup. Spanish and Italian borrowing costs had reached levels that made staying in the currency union arithmetically unsustainable, and the market was, in effect, betting that the ECB either could not or would not stop the breakup.
Mario Draghi spoke in London and said the bank was ready to do whatever it took, and that it would be enough. In September the ECB announced the facility meant to deliver on that, Outright Monetary Transactions.
Not one bond was ever bought under it.
Peripheral yields fell hard over the following months on a programme with no transactions in it. He described a bet, the other side folded, and the cards were never turned over. The bluff worked, and the part worth keeping is that a threat nobody ever executed did more for those markets than most of the money that was actually spent.
The semi-bluff still running
Draghi’s was a pure bluff. He held nothing and never had to show it. The semi-bluff is the version with a draw attached, and the largest one in the market today is the AI build-out.
The hyperscalers have committed hundreds of billions of dollars, years in advance of the revenue that would justify them. The draw is the straightforward half: the demand may arrive, and if it does the spending was correct.
The fold equity is the other half, and it works on the people who think the spending is a mistake. A sceptical manager has one way to express that view, which is to hold less of the largest and best-performing part of the index than their benchmark holds. It is expensive from the day they put it on and stays expensive for as long as the spending continues. They are paying rent on a thesis that cannot be settled for years. Most cannot afford it, so they come back into the position while still believing the spending is excessive. The capex did not have to be justified. It only had to outlast the people who doubted it.
Michael Burry illustrates it. In November 2025 he argued that the hyperscalers were stretching the useful life of their chips to understate depreciation, and put a figure on the profit that manufactured. Days earlier he had taken Scion off the SEC register, describing what remained as “essentially a friends and family fund.” He stayed a sceptic by removing the clients who could ask why he was behind, and most managers do not have that option.
Listed companies face the same squeeze from the other direction. A company that declines to match the spending is repriced as one that has conceded the race. Not betting becomes more expensive than betting.
You are also the one facing the bet
Everything above is written from the aggressor’s chair. Most investors spend their careers in the other one, being bet at.
Poker’s answer is the minimum defence frequency. You do not have to be right about any individual bet. You have to be in the hand often enough that the biggest wins are not all happening without you.
For investors in the market, it requires the same tenacity. Sell every frightening tape and you are the player who folds to every bet, which is handing free money to whoever is betting. It also forfeits the third of the market’s return that arrives in the weeks when nobody wants to be invested. Call every bet and you do worse still, because you will eventually call the one where they have it. Dip-buying through 2008 at a VIX of 20 was ruinous, and the same instinct above 30 was not.
The market pays for the hands nobody plays. So when a tape is frightening, the question is not whether the fear is justified. It usually is. The question is how much capital the fear has already moved out of the way, because that is what the next move is made of. When there is nobody left to fold, the price has to advance the slow way, on cards actually turned over.