The page refreshes every weekend.
Macro Score
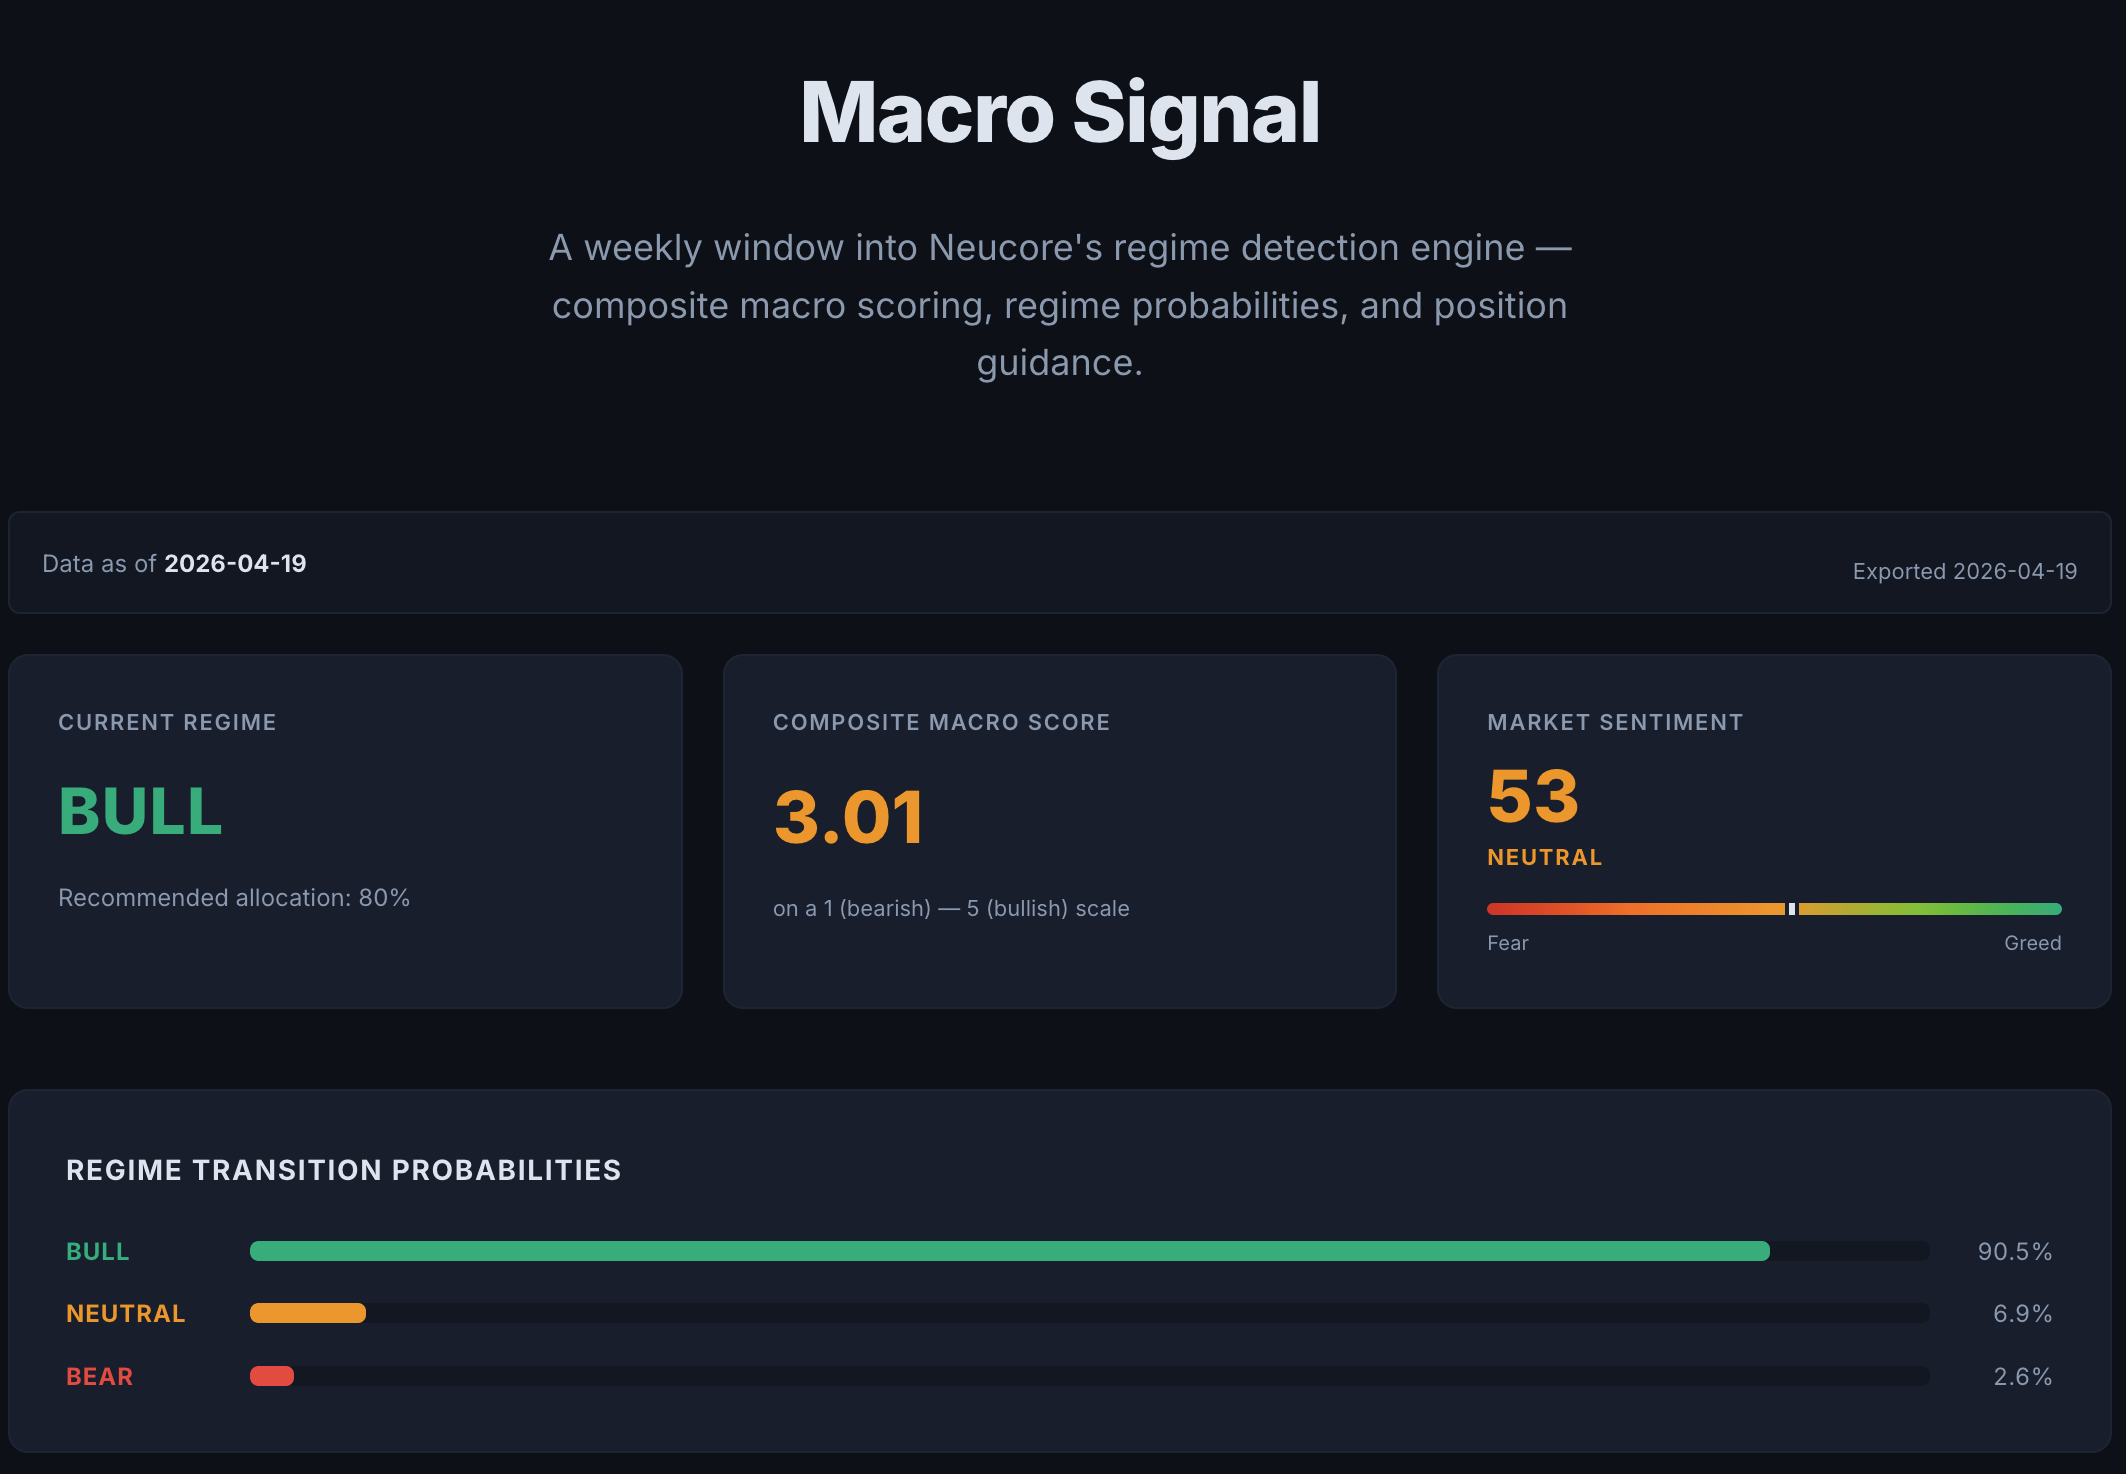
The macro score is one number, on a 1-to-5 scale. Five means bullish tailwinds are strong across the board. One means the environment is actively difficult for equities. Three is neutral.
What Goes Into It
Before condensing the state of the economy into a single indicator, the page looks at it through several lenses, each scored on the same 1-to-5 scale:
- Inflation — is it cooling toward the Fed’s target, or running hot?
- Rates and the yield curve — is the Fed cutting or hiking, and what shape is the bond market in?
- Rate-cut expectations — how many cuts is the market pricing in?
- Money supply and liquidity — is cash in the financial system expanding or contracting?
- Labor market — are jobs still being added, and is unemployment stable?
- The 10-year Treasury yield in context — rising yields in a hiking cycle are very different from falling yields in a cutting cycle.
- Trade and geopolitical risk — tariffs, currency stress, oil, gold, volatility.
Every one of these indicators has clear rules for how the raw data moves the score up or down.
The Regime Overlay
The macro score on its own points to which way the wind is blowing. It does not address whether it is safe to sail. For that, the page adds a market-regime label — Bull, Neutral, or Bear — produced by a predictive model trained on years of market history. The regime answers a different question: given everything the market is doing right now, which historical environment does today most resemble?
The regime and the macro score work together. A strong macro score in a Bull regime is a very different setup from the same score in a Bear regime, and the page reflects that by recommending how much of a full equity position makes sense. Bear regimes dial exposure down sharply, regardless of how the individual sections look — this is deliberate, because bear regimes are when the biggest drawdowns happen.
Together, the macro score and the regime form one side of the coin: a fundamentals-driven read on the environment itself.
Market Sentiment — the Other Side of the Coin
Markets do not always behave the way conditions suggest they should. Investors overshoot in both directions, and the price of that overshoot is paid by whoever is leaning too far with the crowd. The market sentiment index is the counterweight to the macro score and regime — the side of the coin that captures not the conditions themselves, but the emotional positioning around them.
It runs on a 0-to-100 scale, built from signals that reveal the mood of the market: how stocks are trading relative to their long-term trend, how nervous or calm the options market is, and whether money is flowing toward safer assets or riskier ones. The index is calculated in-house from raw market data following our own rules — not pulled from any third-party feed — so every reading is reproducible and traceable back to its source. Low readings mean fear is dominating; high readings mean investors are leaning into risk.
Sentiment is at its most informative when it disagrees with the fundamentals. A weak macro backdrop paired with extreme fear often marks a point where the bad news is already priced in — historically a setup for recovery. A strong macro backdrop paired with extreme greed points the other way: the good news is already in the price, and complacency is doing the rest. The pairing is what matters. Conditions alone, or crowd mood alone, are each incomplete.
The Backtest Chart — Regime Signal in Action
Below the indicators, the page includes a historical backtest chart that puts the regime signal to the test. It runs a simplified strategy — buy SPY when the regime exits Bear, exit long when it re-enters Bear — and compares the result against passive buy-and-hold over the same period. The point is not to prescribe a trading rule but to answer whether the regime label carries real information: does stepping aside during Bear regimes actually reduce drawdowns without giving up too much upside?
The chart has three panels. The top panel plots cumulative portfolio value for the strategy (green) against buy-and-hold SPY (blue dashed), with light shading marking the weeks the strategy is invested. The middle panel shows rolling drawdowns for both. The bottom panel displays the regime state over time as colored dots (green for Bull, amber for Neutral, red for Bear), so you can trace which regime calls drove the entry and exit decisions above. Read the three together: the bottom shows the decisions, the top shows the outcome, and the middle shows what was risked along the way.
Importantly, the strategy has survived both in-sample and out-of-sample testing. The regime model was trained on one portion of market history and then tested forward on data it had never seen — and the drawdown reduction held.
What the Page Is Not
The macro score is not a short-term trading signal. It does not try to predict what the S&P 500 will do next week, and no such claim is made. What the score is designed to do is answer a slower, more useful question: is now a good time to be fully invested, partially invested, or on the sidelines? That question plays out over months and quarters, not days.
Reading Tips
- The two sides of the coin are most informative together. The macro score and regime describe the environment; the sentiment index describes the crowd’s reaction to it.
- The sections pulling the macro score up or down matter as much as the headline. A 2.5 driven by weak inflation and a weak labor market carries a very different message than a 2.5 driven entirely by geopolitical noise.
- Regime changes are the moments worth flagging. Shifts out of Bear, historically, are the most important.
- Sentiment is most actionable at the extremes — and especially when it diverges from what the fundamentals suggest.
- Small weekly moves are mostly noise. The trend over a month is what matters.
The whole page updates weekly. Every number shown comes from public economic data and market prices — there are no black boxes, and every reading can be traced back to its source.